

I'm your trusted local real estate expert!

GET IN TOUCH
Darren Tietsworth

Meet Darren Tietsworth

Born and raised in New Jersey, you're in excellent hands with a local expert!  I love helping clients get to their next level by offering a white-glove level of service to sellers, buyers and investors of New Jersey real estate.  In addition to being recognized as a "Top-Rated" Zillow Premier Agent month after month, I am also proud to be endorsed by world-renowned personal finance guru - Dave Ramsey. 

MORE ABOUT ME
Zillow
Blue circle with
Logo for Homes Pro, featuring an orange star and text
Realtor.com Pro logo with a red house icon and a red

Featured Property

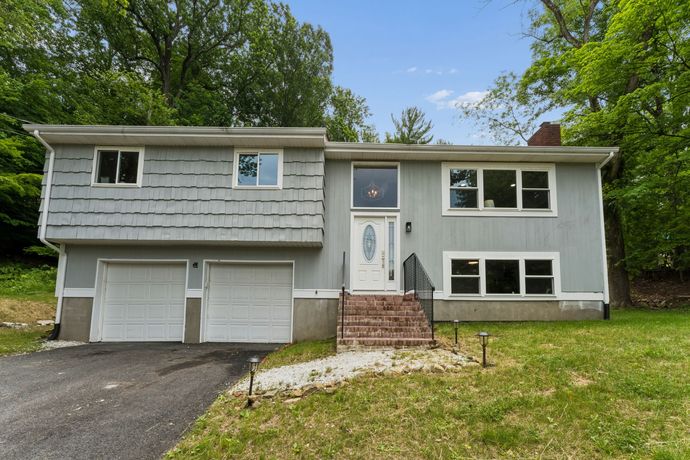
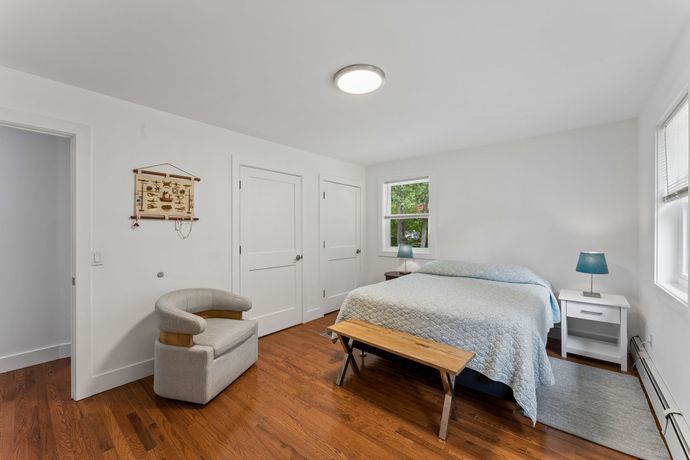
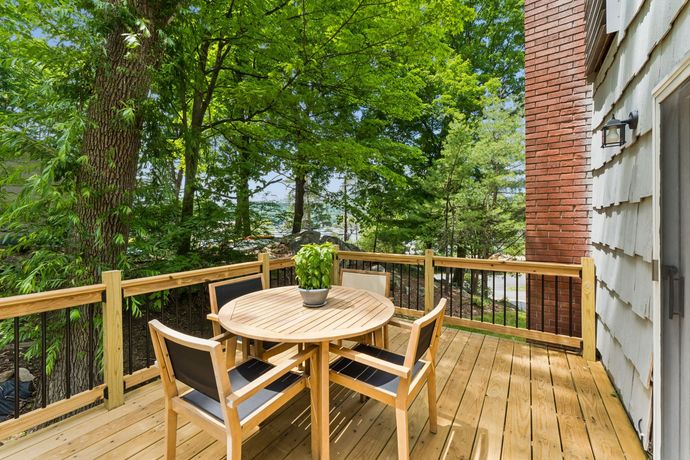
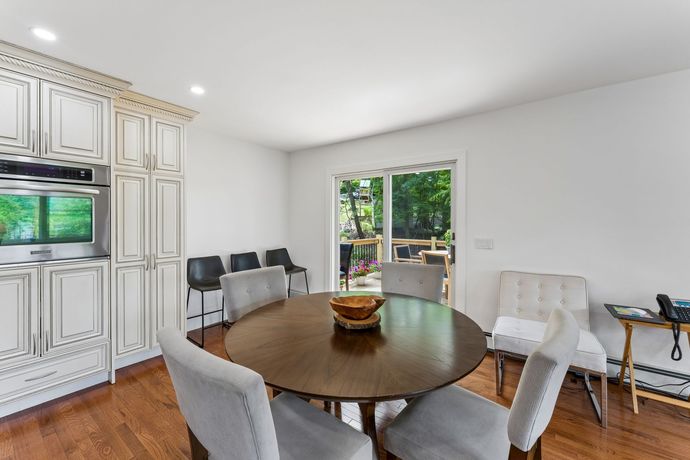
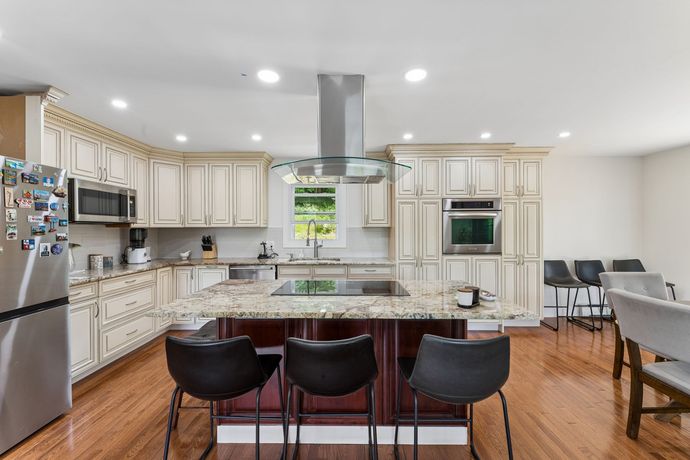
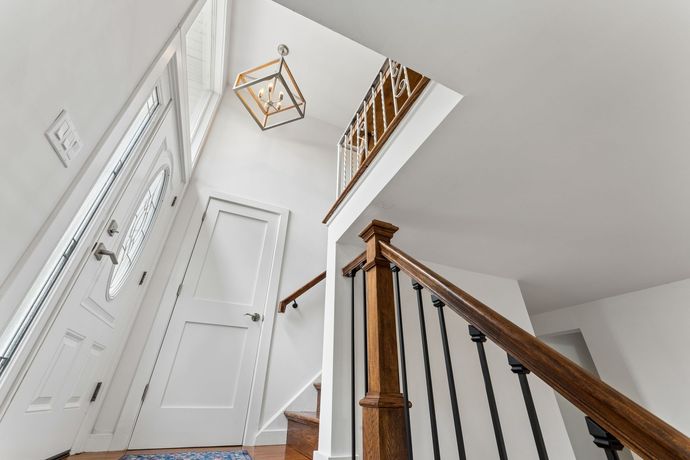
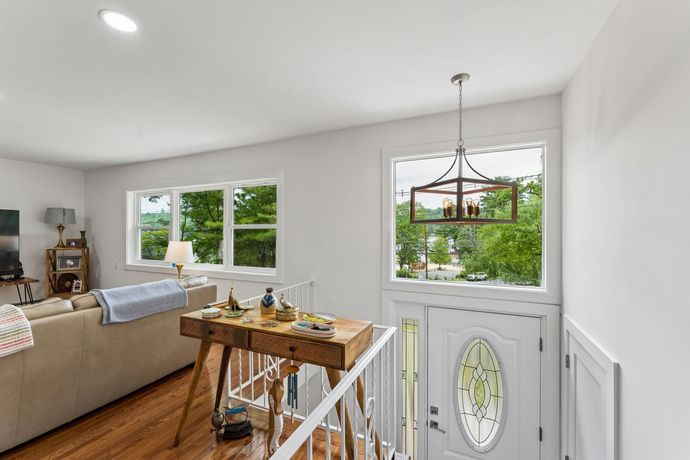
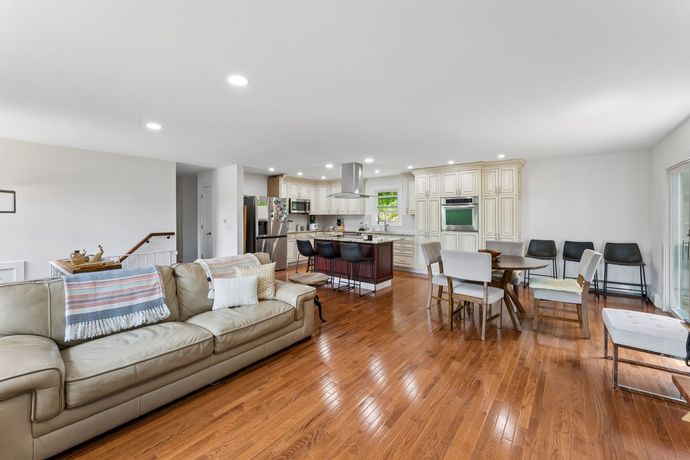
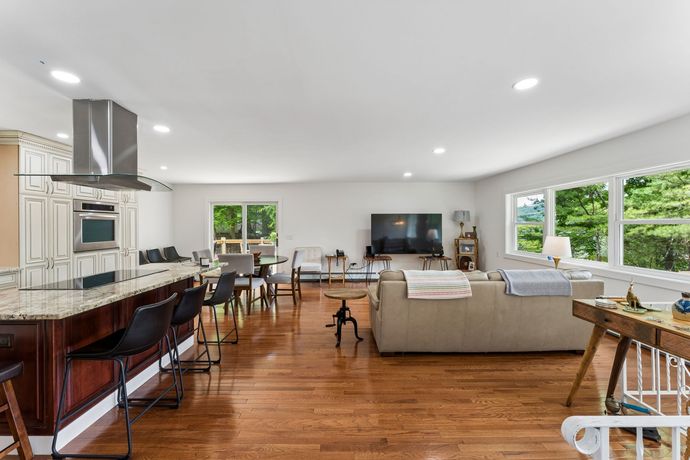
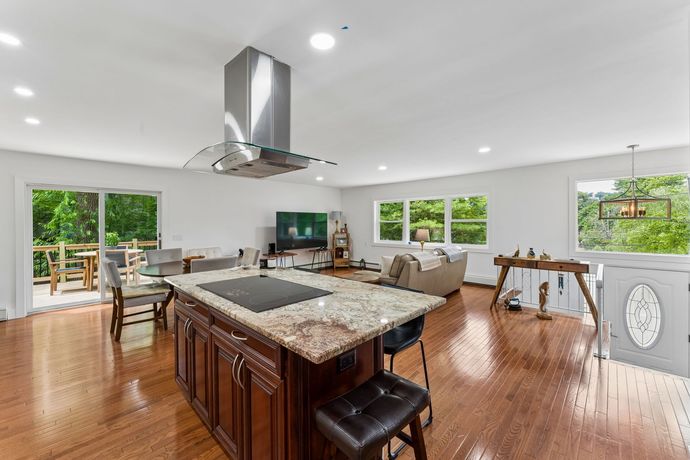
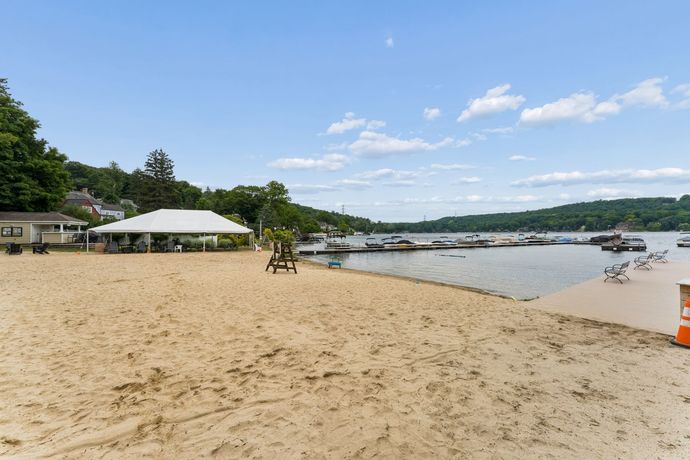
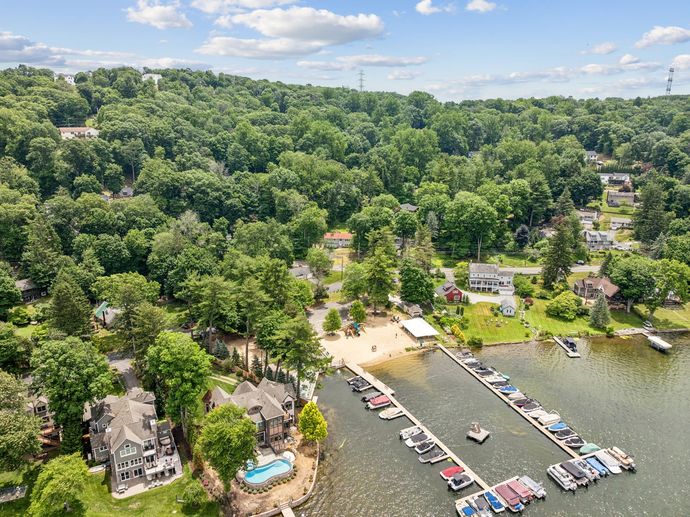
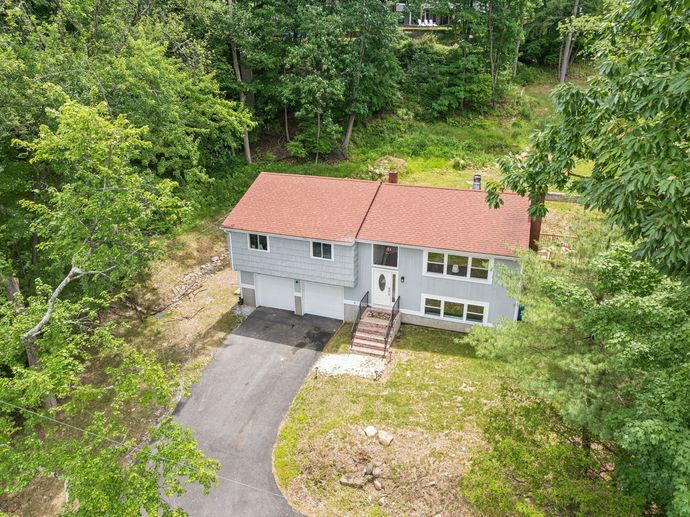
Welcome to Lake Mohawk living at its finest. Ideally located across from Beach 6, this beautifully renovated 4-bedroom, 3-full-bath home offers stunning year-round lake views and access to the exceptional amenities of the Lake Mohawk Country Club community. completely renovated throughout, this move-in-ready home features bright, open living spaces, stylish finishes, updated flooring, and a modern kitchen designed for everyday living and entertaining. The flexible floor plan includes four spacious bedrooms and three fully updated bathrooms, providing plenty of room for guests, or a home office. Large windows fill the home with natural light while showcasing picturesque views of Lake Mohawk as well as a new elevated deck off the main living area provides beautiful lake views along with a spot to enjoy dining al fresco. A brand-new septic system adds significant value and peace of mind for the next Owner. Enjoy the convenience of being directly across from Beach 6 and take advantage of Lake Mohawk's renowned resort-style amenities, including private beaches, boating, fishing, swimming, sailing, tennis courts, playgrounds, community events, waterfront dining, and the charming boardwalk and village area. Whether you're looking for a full-time residence or a weekend retreat, this beautifully updated home combines modern comfort, breathtaking water views, and the unique lake lifestyle that makes Lake Mohawk one of New Jersey's most desirable communities.  Click to call today to schedule a private tour!

Property Features

  • 4 Spacious Bedrooms
  • 3 Full Bathrooms
  • New Gourmet Kitchen
  • New Raised Deck with Lake Views
  • Huge 2 Car Garage
  • New Hardwood Flooring
  • New Septic System
  • Part of Lake Mohawk Homeowner's Association
  • Across from Beach #6 and Lake Club Amenities
  • Click here for Floor Plan (1st Floor)
  • Click here for Floor Plan (2nd Floor)
Schedule a Tour
  • 403 E. Shore Trail, Sparta

    Write your caption here
    Button
  • Four Spacious Bedrooms

    Write your caption here
    Button
  • Raised Deck with Lake Views

    Write your caption here
    Button
  • Dining Area Opens to Deck

    Write your caption here
    Button
  • Chef's Kitchen

    Write your caption here
    Button
  • Elegant Design Features

    Write your caption here
    Button
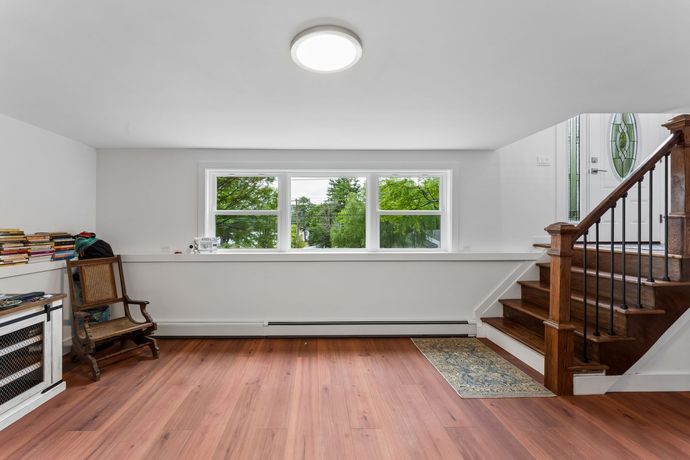
  • Convenient Bi-Level Living

    Write your caption here
    Button
  • Open Concept

    Write your caption here
    Button
  • Lots of Natural Light & Lake Views

    Write your caption here
    Button
  • Beautiful Hardwood Floors

    Write your caption here
    Button
  • Lower Level is Perfect for Visiting Guests

    Write your caption here
    Button
  • Walk to Beach #6 and Club Amenities

    Write your caption here
    Button
  • Adjacent to Lake Mohawk Beaches & Boating

    Write your caption here
    Button
  • Spacious Lot

    Write your caption here
    Button

Priced to sell at $785,000!

PROFESSIONAL SERVICES

BUYER'S REPRESENTATIVE

LEARN MORE

SELLER'S REPRESENTATIVE

Selling your home can be a daunting task, especially if you are taking it on by yourself.  Hire a professional and save yourself a lot of headaches.  Ask about our complimentary Home Warranty with your listing.

LEARN MORE

PROPERTY MANAGEMENT

LEARN MORE
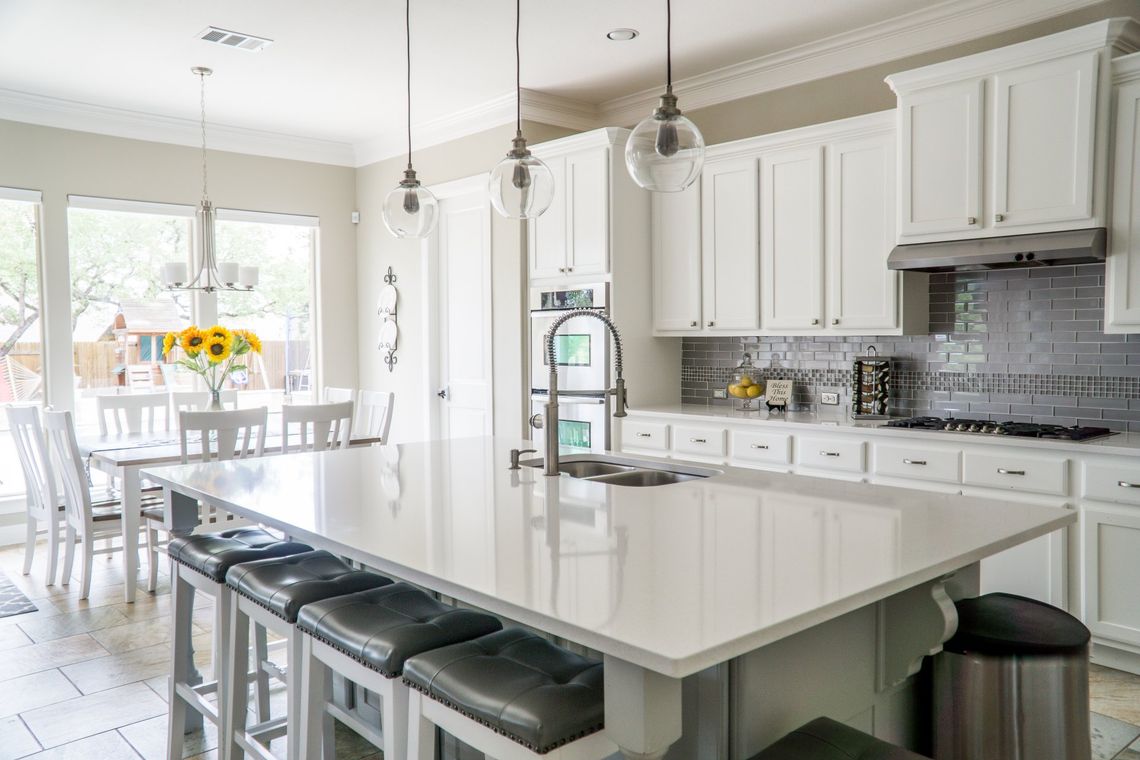
A kitchen with a large island in the middle of it.

EXPERTISE

With my extensive expertise and resources, we can collaborate throughout the entire process to achieve your real estate objectives.

  • Extensive knowledge of pricing trends and market conditions


  • Access to an extensive network of industry professionals


  • Support and guidance throughout the entire buying or selling process


  • Passion for helping clients find their dream homes (especially first-time buyers)


  • Tech-Savvy and able to take advantage of all the social media tools


  • Dedication to providing exceptional value & assisting in your goals

WHY WORK WITH ME?

MARKET EXPERTISE

Market knowledge goes beyond simply knowing the neighborhoods. Ask me about the area you have in mind, available parking, or standard bedroom sizes in the area.

CLIENT-FOCUSED

Your time is valuable. That's why take the time upfront to understand your unique wants, needs and dislikes to ensure the rest of our time together is productive as possible.

RESPONSIVE

You have questions and I have answers. I'll make sure that you feel confident and empowered when it comes to make important real estate and purchasing decisions.

REFERRAL NETWORK

This industry is all about who you know. I can connect you with the top mortgage brokers, real estate attorneys, home inspectors, home stagers, and more...

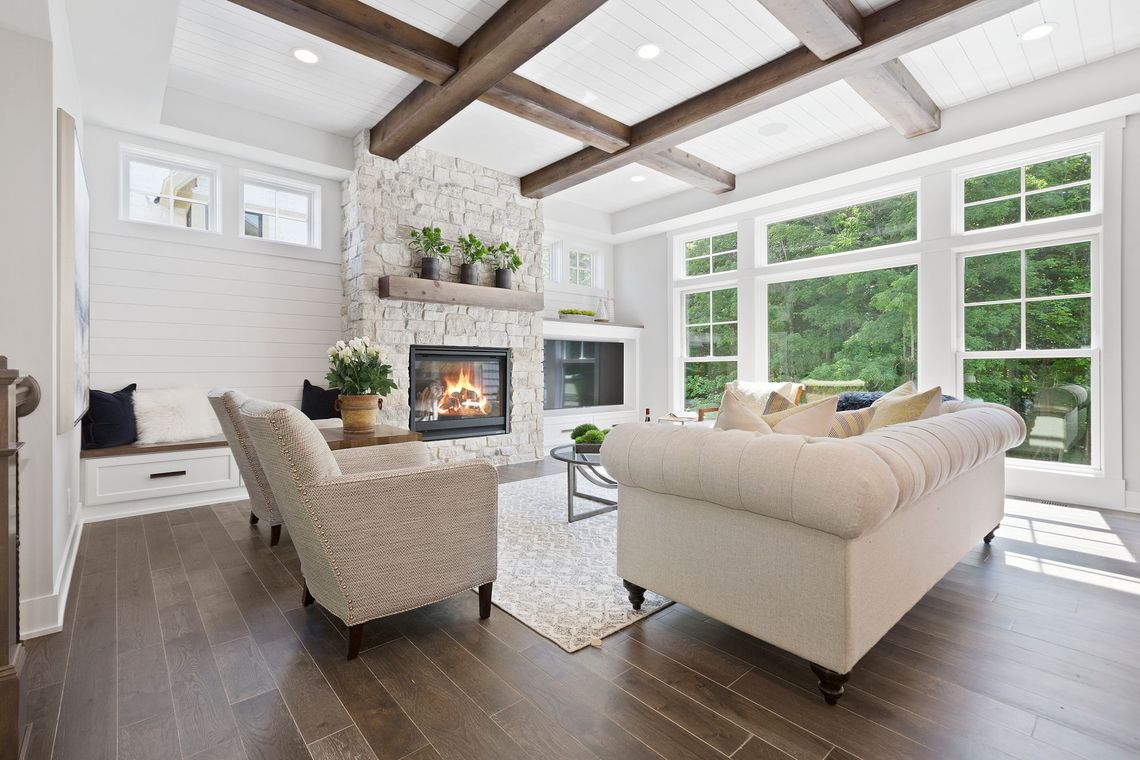
A living room filled with furniture and a fireplace.
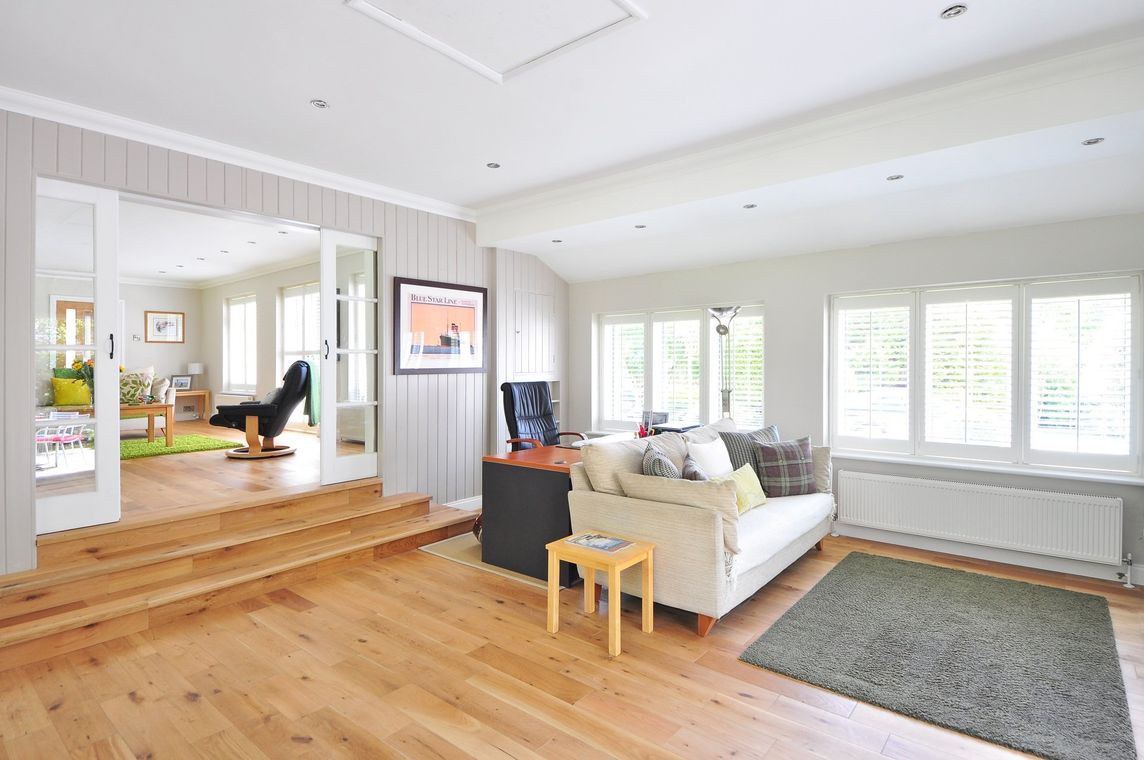
A living room with a couch , chair , table and rug.
A kitchen with white cabinets and a large island in the middle.

WHAT MY CLIENTS SAY

Two black quotation marks.

"We are incredibly grateful for the exceptional service provided by Darren Tietsworth in helping us find the perfect house and location that fit our family's needs. From the very beginning, Darren was instrumental in understanding our requirements and guiding us through the entire process with utmost professionalism."


- Kristin G.

Two black quotation marks.

“Darren is an incredible realtor delivering a level of service that is unmatched. We had our very first offer accepted during the craziness that is the current market and it was because of his guidance and recommendations. We always felt like a priority to him and that he truly had our best interests at heart.”


- Tara D.

Double quotation marks, black.

"I had the pleasure of working with Darren Tietsworth for my recent home sale in Lavallette and I couldn't have been happier with the experience. From the moment I met Darren, I knew I was in capable hands.  Throughout the entire process, Darren maintained clear and open communication.”


- Joe D.

VIEW ALL TESTIMONIALS

LATEST BLOG NEWS

By darren.njre • October 16, 2026
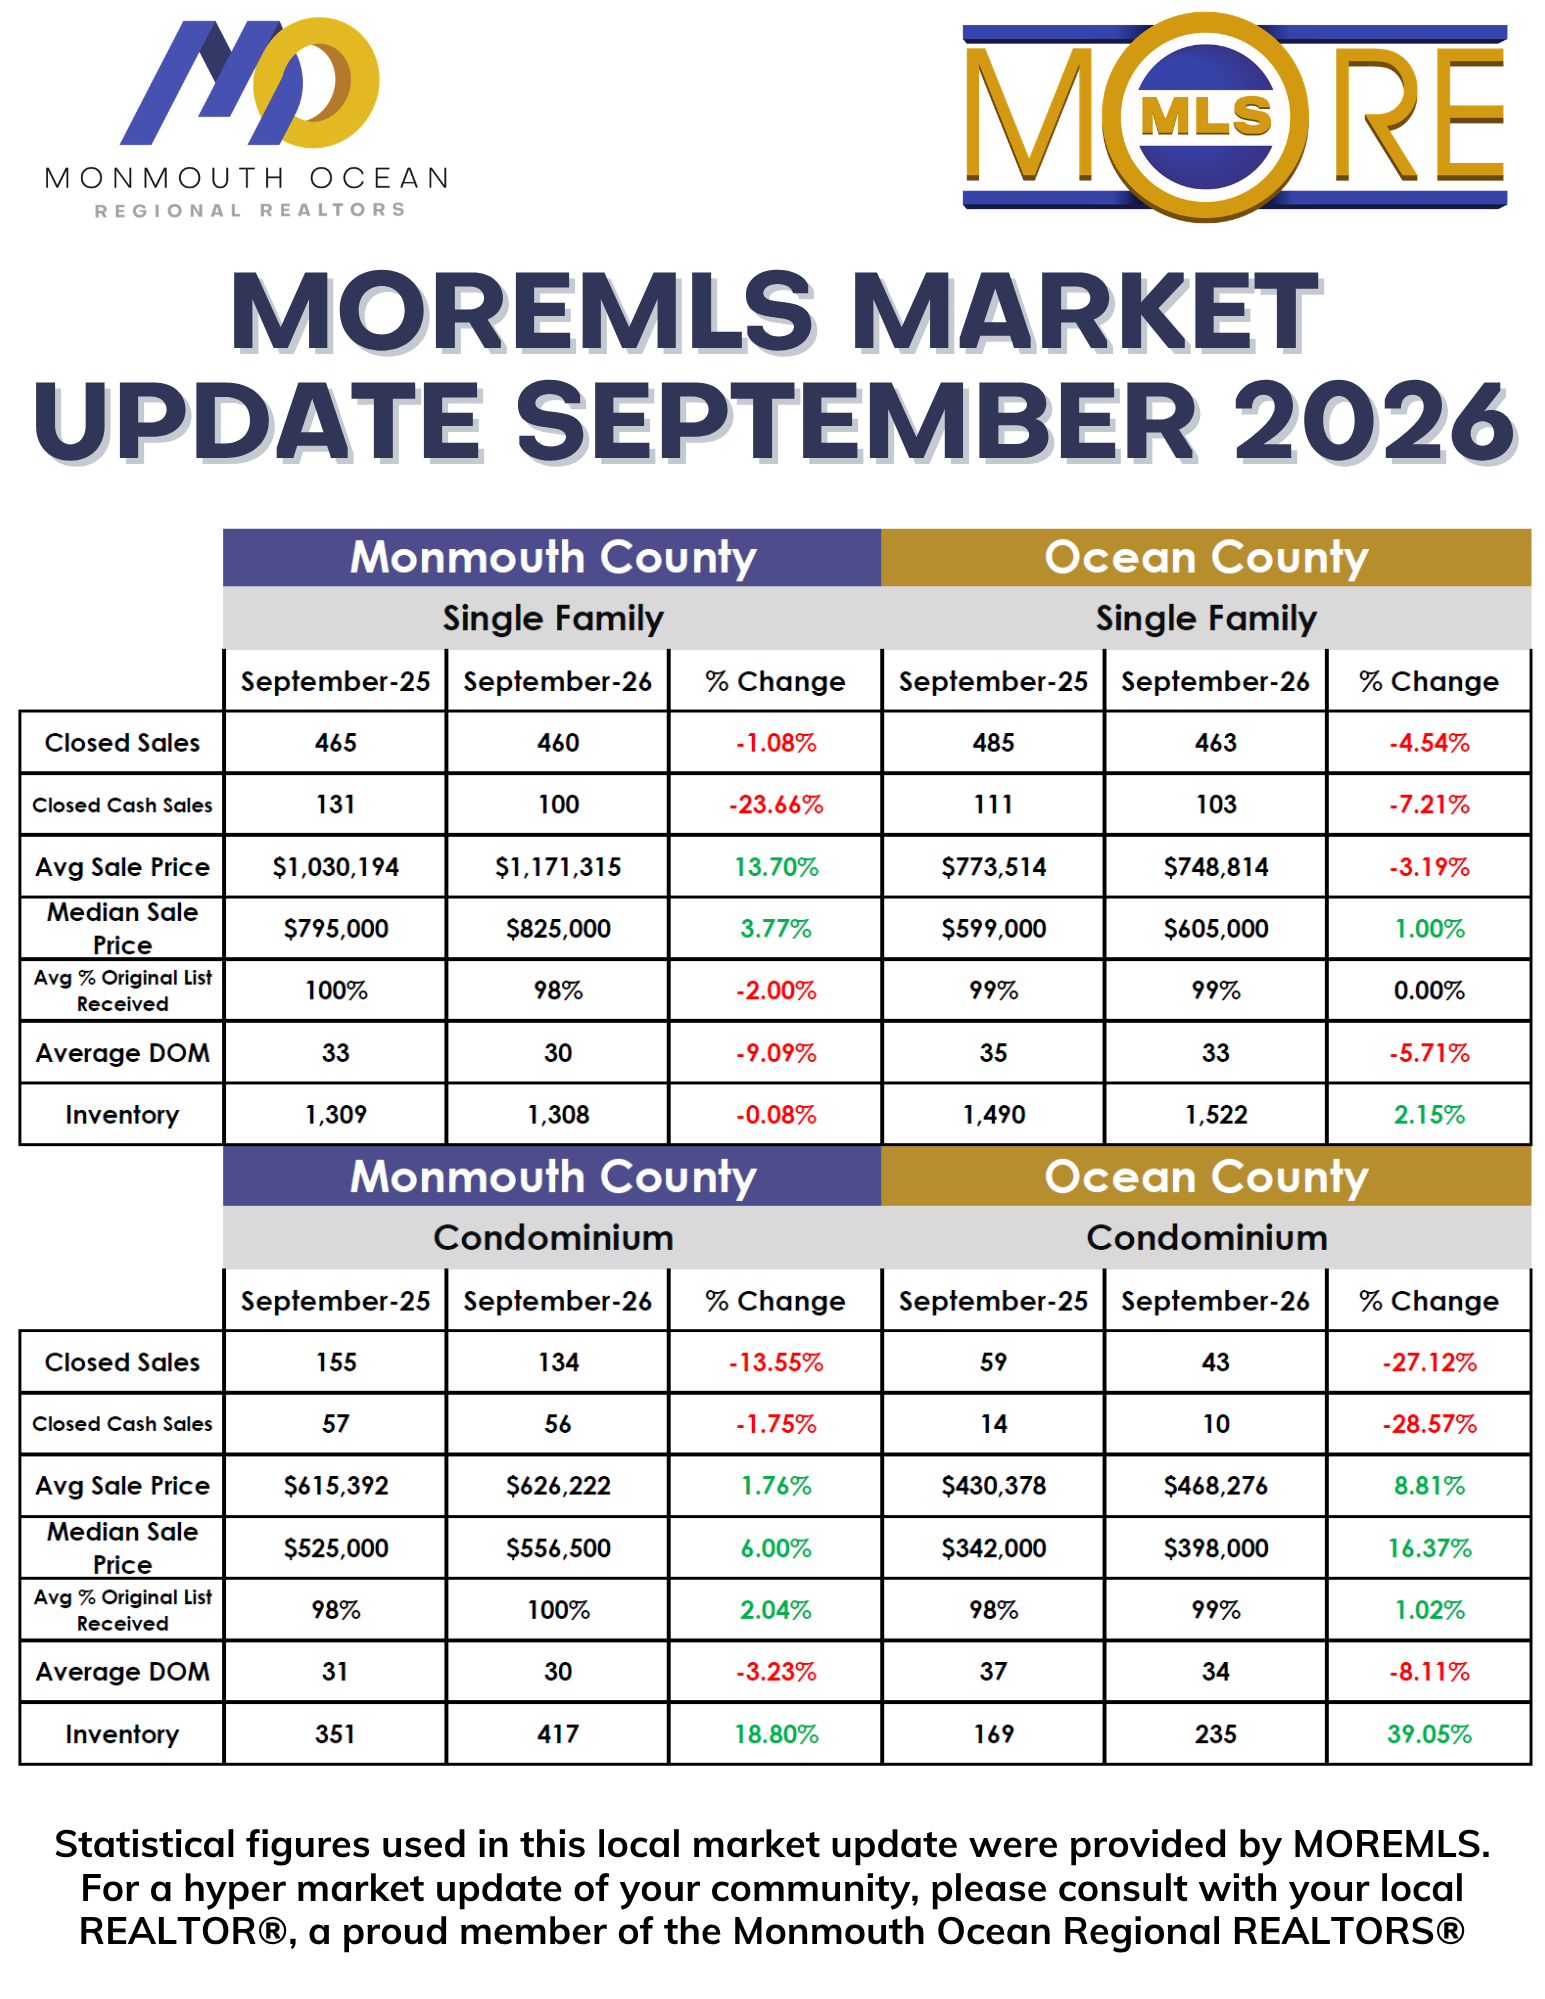
September 2026 Real Estate Market Report: What Buyers and Sellers Need to Know in Monmouth and Ocean Counties The latest September 2026 market data from MOREMLS offers valuable insight into the changing real estate landscape across Monmouth and Ocean counties. Comparing September 2026 with September 2025, the numbers reveal a market characterized by fewer closed transactions, mixed pricing trends, and changing inventory levels. For homeowners considering selling, buyers preparing to enter the market, and investors evaluating opportunities along the Jersey Shore, these statistics provide a helpful snapshot of current conditions. Let's take a closer look at what the numbers mean for single-family homes and condominiums in both counties. Monmouth County: Single-Family Home Prices Continue to Rise Monmouth County's single-family housing market demonstrated notable price strength in September 2026, even as closed sales declined slightly compared with the same month last year. Key statistics for September 2026: Closed sales: 460, down 1.08% from 465 in September 2025. Average sale price: $1,171,315, up 13.70% from $1,030,194. Median sale price: $825,000, up 3.77% from $795,000. Average days on market: 30, down from 33 days. Inventory: 1,308 homes, virtually unchanged from 1,309 a year earlier. Average percentage of original list price received: 98%, compared with 100% last year. The most striking figure is the 13.70% increase in the average sale price. The median sale price also increased, suggesting that price growth was not limited to the average alone. However, the larger increase in the average may reflect changes in the mix of homes sold, including a greater share of higher-priced properties. Homes also spent fewer days on the market, averaging 30 days compared with 33 days in September 2025. This suggests that well-positioned properties can still attract buyers relatively quickly. At the same time, sellers received an average of 98% of their original asking price, compared with 100% last year. This indicates that pricing strategy and negotiation remain important, even in a market where home values have increased. What this means: Monmouth County continues to show strong pricing, but sellers should not assume that every property will command its original asking price. Buyers may face higher purchase prices, making preparation, financing, and a clear understanding of local property values essential. Ocean County: A More Mixed Market for Single-Family Homes Ocean County's single-family market showed a different pattern, with a modest decline in the average sale price and a slight increase in available inventory. Key statistics for September 2026: Closed sales: 463, down 4.54% from 485. Average sale price: $748,814, down 3.19% from $773,514. Median sale price: $605,000, up 1.00% from $599,000. Average days on market: 33, down from 35 days. Inventory: 1,522 homes, up 2.15% from 1,490. Average percentage of original list price received: 99%, unchanged from the prior year. The difference between the average and median sale prices deserves attention. Although the average price declined, the median price increased slightly. This can happen when the mix of properties sold changes from one year to the next; it does not necessarily mean that the value of a typical home has fallen. Closed sales declined, while inventory increased modestly. Buyers may therefore find more options than they did a year ago, although availability and competition will vary by neighborhood, price range, and property condition. Homes averaged 33 days on the market, two fewer than the previous September. Sellers also received an average of 99% of their original asking price, indicating that list-price realization remained relatively steady. What this means: Ocean County buyers may have opportunities to compare more properties and negotiate thoughtfully. Sellers can still compete effectively, but accurate pricing and strong presentation are important in a market where overall sales volume has softened. Monmouth County Condominiums: Prices and Inventory Move Higher The condominium market in Monmouth County showed positive price trends alongside a meaningful increase in available inventory. Key statistics for September 2026: Closed sales: 134, down 13.55% from 155. Average sale price: $626,222, up 1.76% from $615,392. Median sale price: $556,500, up 6.00% from $525,000. Average days on market: 30, down from 31 days. Inventory: 417 units, up 18.80% from 351. Average percentage of original list price received: 100%, up from 98%. The rise in the median sale price is encouraging for condominium owners, while the increase in inventory gives buyers more properties to consider. However, closed condominium sales fell by nearly 14% year over year. That decline suggests that higher prices have not translated into a greater number of completed transactions. One positive sign for sellers is that the average percentage of original asking price received reached 100%. While this is an aggregate figure rather than a guarantee for any individual listing, it indicates that appropriately priced condominiums continued to perform well. What this means: Buyers may benefit from a broader selection of condominiums, while sellers can still achieve favorable results when their properties are priced and marketed effectively. Buyers should also compare association fees, maintenance costs, amenities, and any applicable condominium association requirements when evaluating a purchase. Ocean County Condominiums: The Biggest Inventory Increase Ocean County's condominium market recorded the sharpest inventory growth among the four market segments in the report. Prices also increased, even as closed sales declined significantly. Key statistics for September 2026: Closed sales: 43, down 27.12% from 59. Average sale price: $468,276, up 8.81% from $430,378. Median sale price: $398,000, up 16.37% from $342,000. Average days on market: 34, down from 37 days. Inventory: 235 units, up 39.05% from 169. Average percentage of original list price received: 99%, up from 98%. The increase in the median sale price is the largest percentage gain among the four average and median price measures shown in the graphic. Nevertheless, the decline in closed sales and the substantial rise in inventory suggest that buyers and sellers are experiencing different sides of the market. Buyers may have more opportunities to compare condominium options, while sellers face a larger pool of competing listings. Even with higher reported sale prices, the decline in transactions means that pricing and property-specific demand deserve careful attention. The increase in prices should also be interpreted in context. With only 43 closed sales in September 2026, changes in the mix of condominiums sold can have a considerable effect on monthly average and median figures. What this means: Ocean County condominium buyers may have greater choice and room to evaluate their options. Sellers should pay close attention to competing listings and avoid relying solely on last year's sale prices when determining an asking price. Four Market Trends Worth Watching Across both counties and both property types, several important patterns emerge from the September figures. 1. Closed sales declined in every category. The number of closed sales fell year over year across all four segments: Monmouth single-family homes: down 1.08%. Ocean single-family homes: down 4.54%. Monmouth condominiums: down 13.55%. Ocean condominiums: down 27.12%. The largest decline occurred in Ocean County condominiums. These figures show fewer completed transactions, but they do not establish the cause. Mortgage rates, affordability, seasonal patterns, available inventory, and other local factors may all influence sales activity. 2. Prices were stronger in Monmouth County and in both condominium markets. Monmouth County single-family homes recorded a 13.70% increase in average sale price. Ocean County single-family homes, by contrast, saw a 3.19% decrease in the average, although the median rose 1.00%. Condominium prices increased in both counties, with Ocean County showing the larger percentage gains in average and median sale prices. These differences reinforce the importance of evaluating the specific county and property type rather than relying on one broad market headline. 3. Inventory is increasing most noticeably for condominiums. Single-family inventory remained nearly flat in Monmouth County and increased 2.15% in Ocean County. Condominium inventory rose 18.80% in Monmouth County and 39.05% in Ocean County. For buyers, additional listings can mean more opportunities to compare properties. For sellers, it can mean greater competition. However, inventory alone does not tell us how many months of supply are available, because that calculation also depends on the pace of sales. 4. Homes are spending slightly less time on the market. Average days on market declined in all four categories: Monmouth single-family homes: 30 days. Ocean single-family homes: 33 days. Monmouth condominiums: 30 days. Ocean condominiums: 34 days. This is an important counterpoint to the decline in closed sales. Properties that sell are, on average, spending fewer days on the market than they did a year ago. That does not necessarily mean every listing is selling faster, since the statistic reflects properties that reached a sale and can be affected by the mix of transactions. Advice for Homebuyers in Fall 2026 For buyers, the September market data suggest that preparation and flexibility remain essential. Understand the local market. A buyer considering a single-family home in Monmouth County may face a different pricing environment than someone searching for a condominium in Ocean County. Compare recent comparable sales. Countywide averages provide useful context, but recent sales of similar properties in the same neighborhood are generally more relevant when determining fair value. Explore your options. Rising condominium inventory, particularly in Ocean County, may give buyers more properties to evaluate. Take time to compare condition, location, carrying costs, and potential resale considerations. Get financing in order. A mortgage preapproval and a clear budget can help buyers move decisively when an appropriate property becomes available. Negotiate strategically. Average sale prices and list-price percentages do not guarantee that a particular home will sell at a given price. Property condition, seller circumstances, and competing offers all matter. Advice for Home Sellers in Fall 2026 Sellers can still find opportunities in this market, but a successful sale begins with a realistic understanding of the competition. Price your home based on current comparable sales. Strong year-over-year price gains in some segments do not mean every property has appreciated at the same rate. Make a strong first impression. Professional photography, thoughtful staging, and attention to maintenance can help a listing stand out. Monitor competing inventory. This is especially important for condominium sellers, given the substantial year-over-year inventory increases in both counties. Be prepared to negotiate. Monmouth single-family sellers received an average of 98% of original list price, while the other three categories ranged from 99% to 100%. These figures are useful benchmarks, not guaranteed outcomes. Work with a local real estate professional. An experienced agent can help interpret neighborhood-level activity, evaluate competing listings, and develop a marketing strategy suited to your property and timeline. The Bottom Line: Local Knowledge Matters September 2026's MOREMLS statistics show that Monmouth and Ocean counties continue to offer distinct real estate opportunities. Monmouth County's single-family market stands out for its strong increase in average sale price, while Ocean County's single-family market shows a slight decline in average price alongside a modest increase in inventory. Condominium prices increased in both counties, but sales declined and inventory rose, particularly in Ocean County. For buyers, the changing inventory picture may create opportunities to compare properties and negotiate. For sellers, the data reinforce the importance of competitive pricing, effective marketing, and an understanding of current local demand. Ultimately, countywide statistics are only part of the story. Neighborhood, price range, property condition, and individual circumstances all influence the outcome of a real estate transaction. Whether you're thinking about buying, selling, or simply monitoring your home's value, the best starting point is a conversation with a knowledgeable local REALTOR® who can put these numbers into context for your specific market. Source: September 2026 MOREMLS market statistics, comparing September 2025 with September 2026. Figures reflect reported single-family and condominium activity in Monmouth and Ocean counties. Average and median sale prices may be influenced by the mix of properties sold during each period. Market statistics are descriptive and do not guarantee future results.
By darren.njre • September 4, 2026
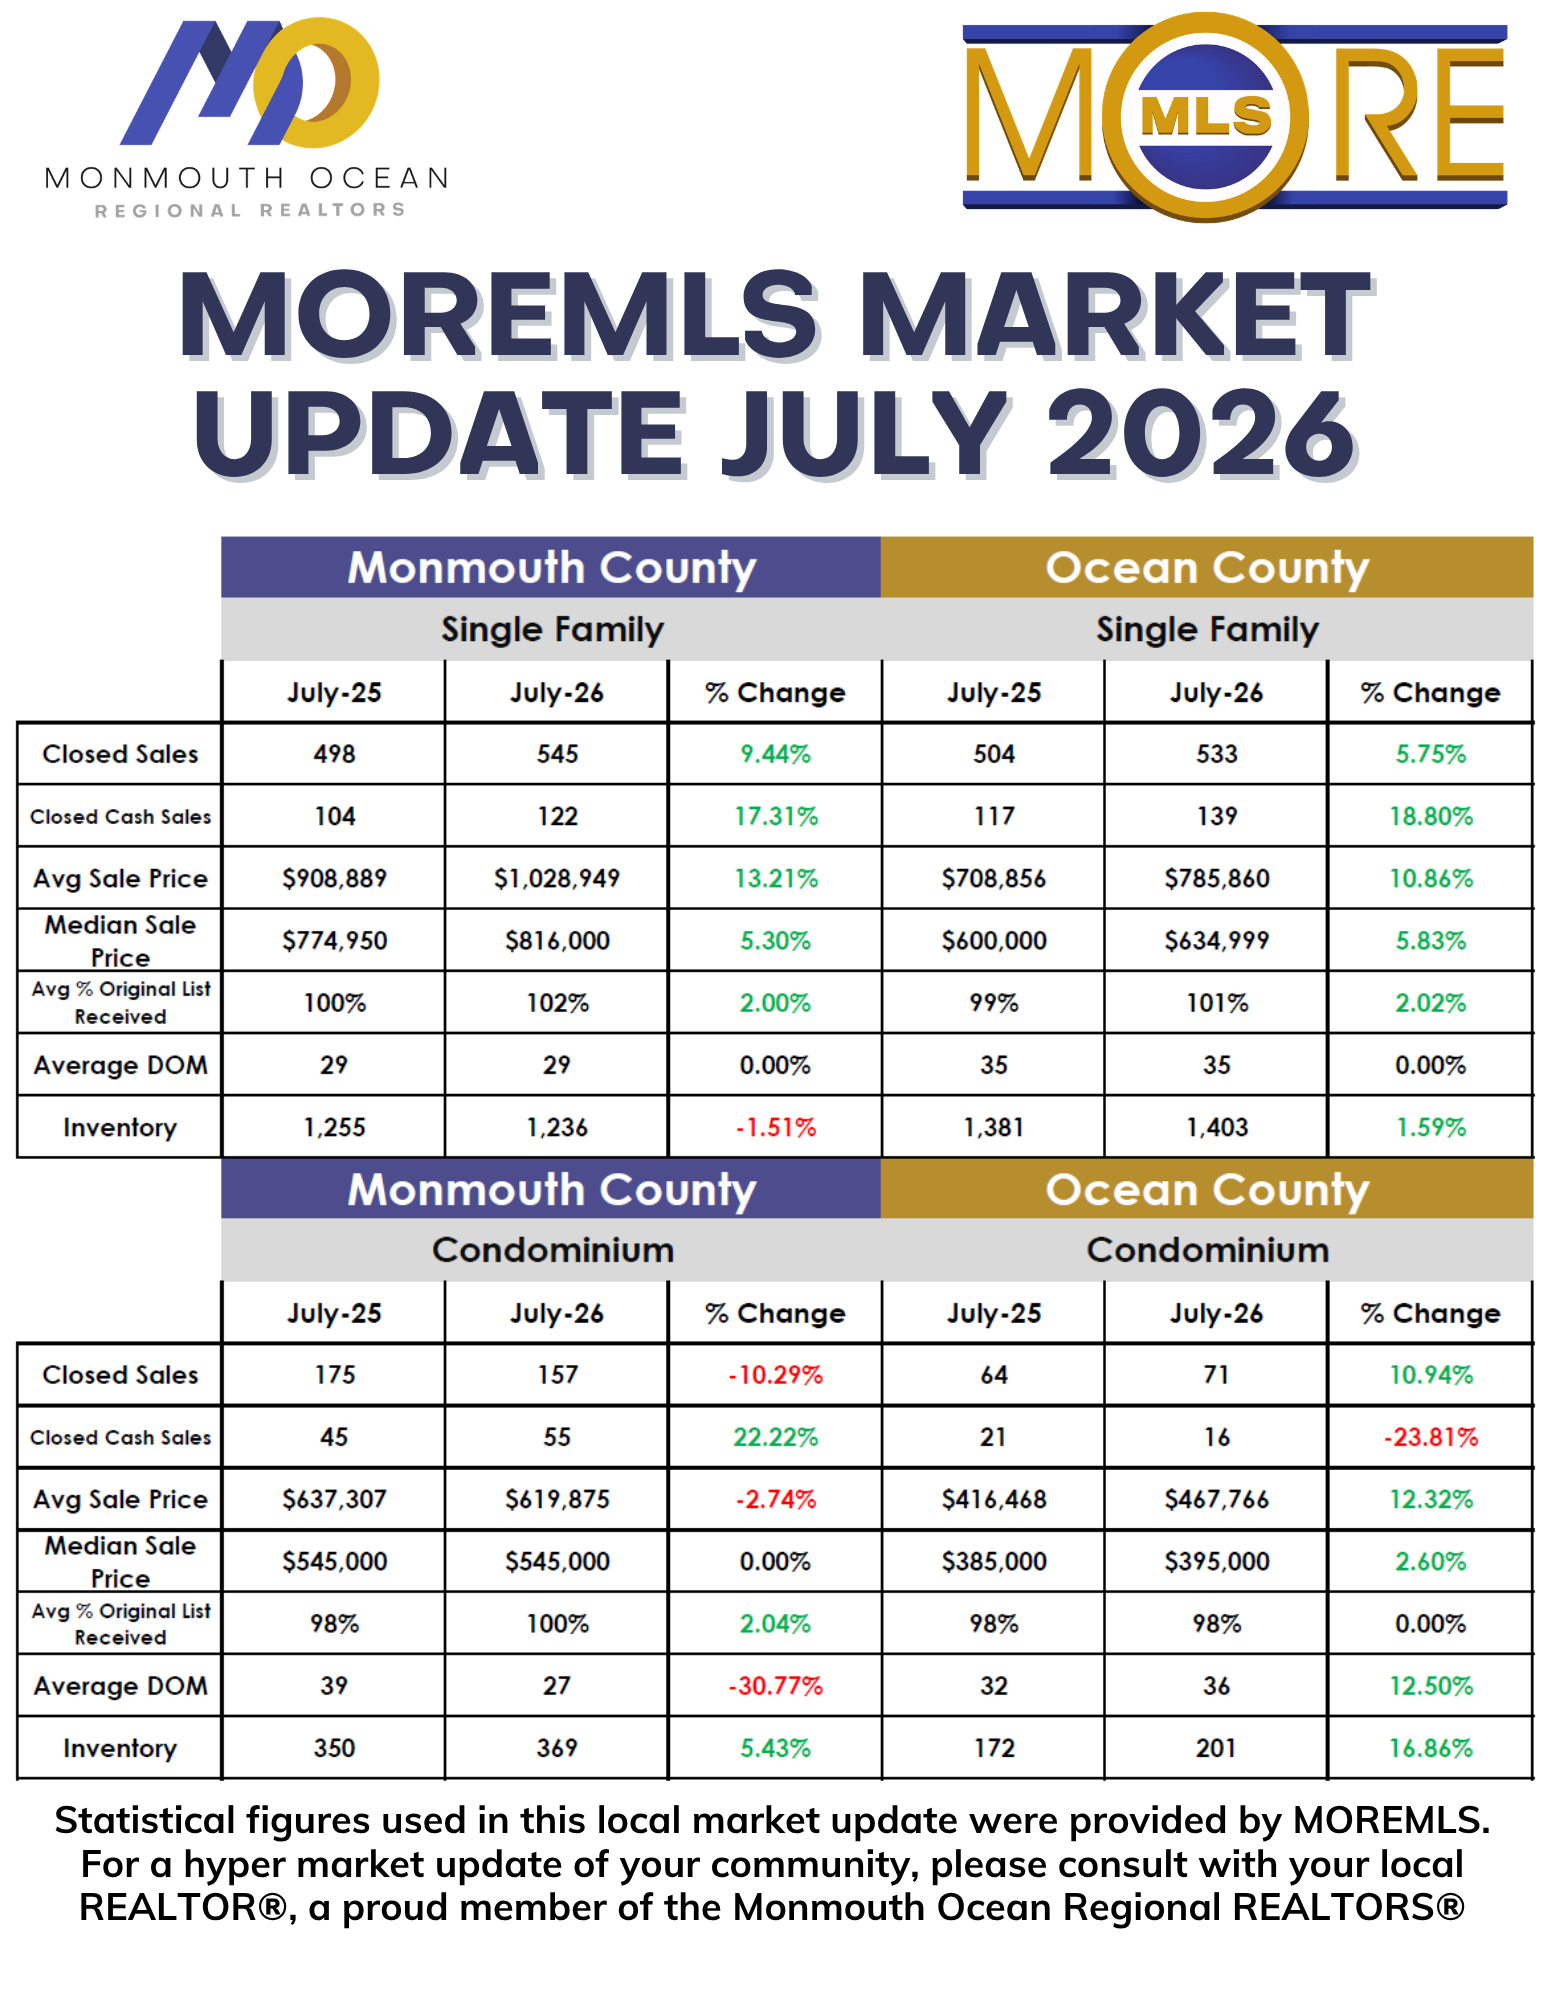
July 2026 Market Stats - A tale of multiple markets The July numbers show a generally strong Jersey Shore housing market, particularly for single-family homes. Prices are higher than a year ago in both counties, while homes continue to sell very close to—or above—their original asking prices. For Buyers: Competition remains significant. Monmouth County single-family homes sold for an average of 102% of original list price, while Ocean County averaged 101%. Median prices rose to $816,000 in Monmouth (+5.3%) and $634,999 in Ocean (+5.8%). The encouraging news is inventory: Ocean County single-family inventory increased slightly, while condo inventory grew 5.4% in Monmouth and 16.9% in Ocean, potentially giving condo buyers more choices and negotiating opportunities. For Sellers: Single-family conditions remain favorable. Average sale prices jumped 13.2% in Monmouth County to $1.029 million and 10.9% in Ocean County to $785,860. Homes averaged just 29 days on market in Monmouth and 35 days in Ocean, unchanged from last year. Cash purchases also increased substantially in both counties. The condo market is more mixed. Monmouth condo sales declined 10.3% and average prices fell 2.7%, although average market time improved dramatically from 39 to 27 days. Ocean County condos saw sales increase 10.9% and average prices rise 12.3%, but inventory climbed nearly 17% and average market time increased to 36 days. Bottom line: Single-family sellers continue to have considerable leverage, while buyers should be prepared for well-priced homes to attract strong offers. The expanding condo inventory—particularly in Ocean County—could create better opportunities for buyers heading into the late-summer and fall market. During the past year, I’ve donated thousands of dollars to a variety of deserving pet rescue charities as part of my commitment to giving back a portion of my commissions to pets in need. Throughout the upcoming year, my commitment continues, so if you are a pet-lover, let’s talk. You're browsing the official website of Realtor Darren Tietsworth, but did you know I also have some other websites to help you with your search. HolidayCityHomes.com – browse and sell your home in this premier 55+ community JerseyShoreCondo.com – buying, selling or renting condos on the Jersey Shore. OpenHouseNewJersey.com – for Open Houses in Ocean or Monmouth Counties? JerseyShoreCribs.com – for renters & landlords along the Shore JerseyShoreHomez.com – for buyers & sellers in the top Shore towns Exit135.com – Search for homes in Union, Morris, Somerset Counties Contact us today to discuss how we can help to buy or sell a home. You can call or text us at 908.578.3630 or use our contact form here. We look forward to working with you.
By darren.njre • July 18, 2026
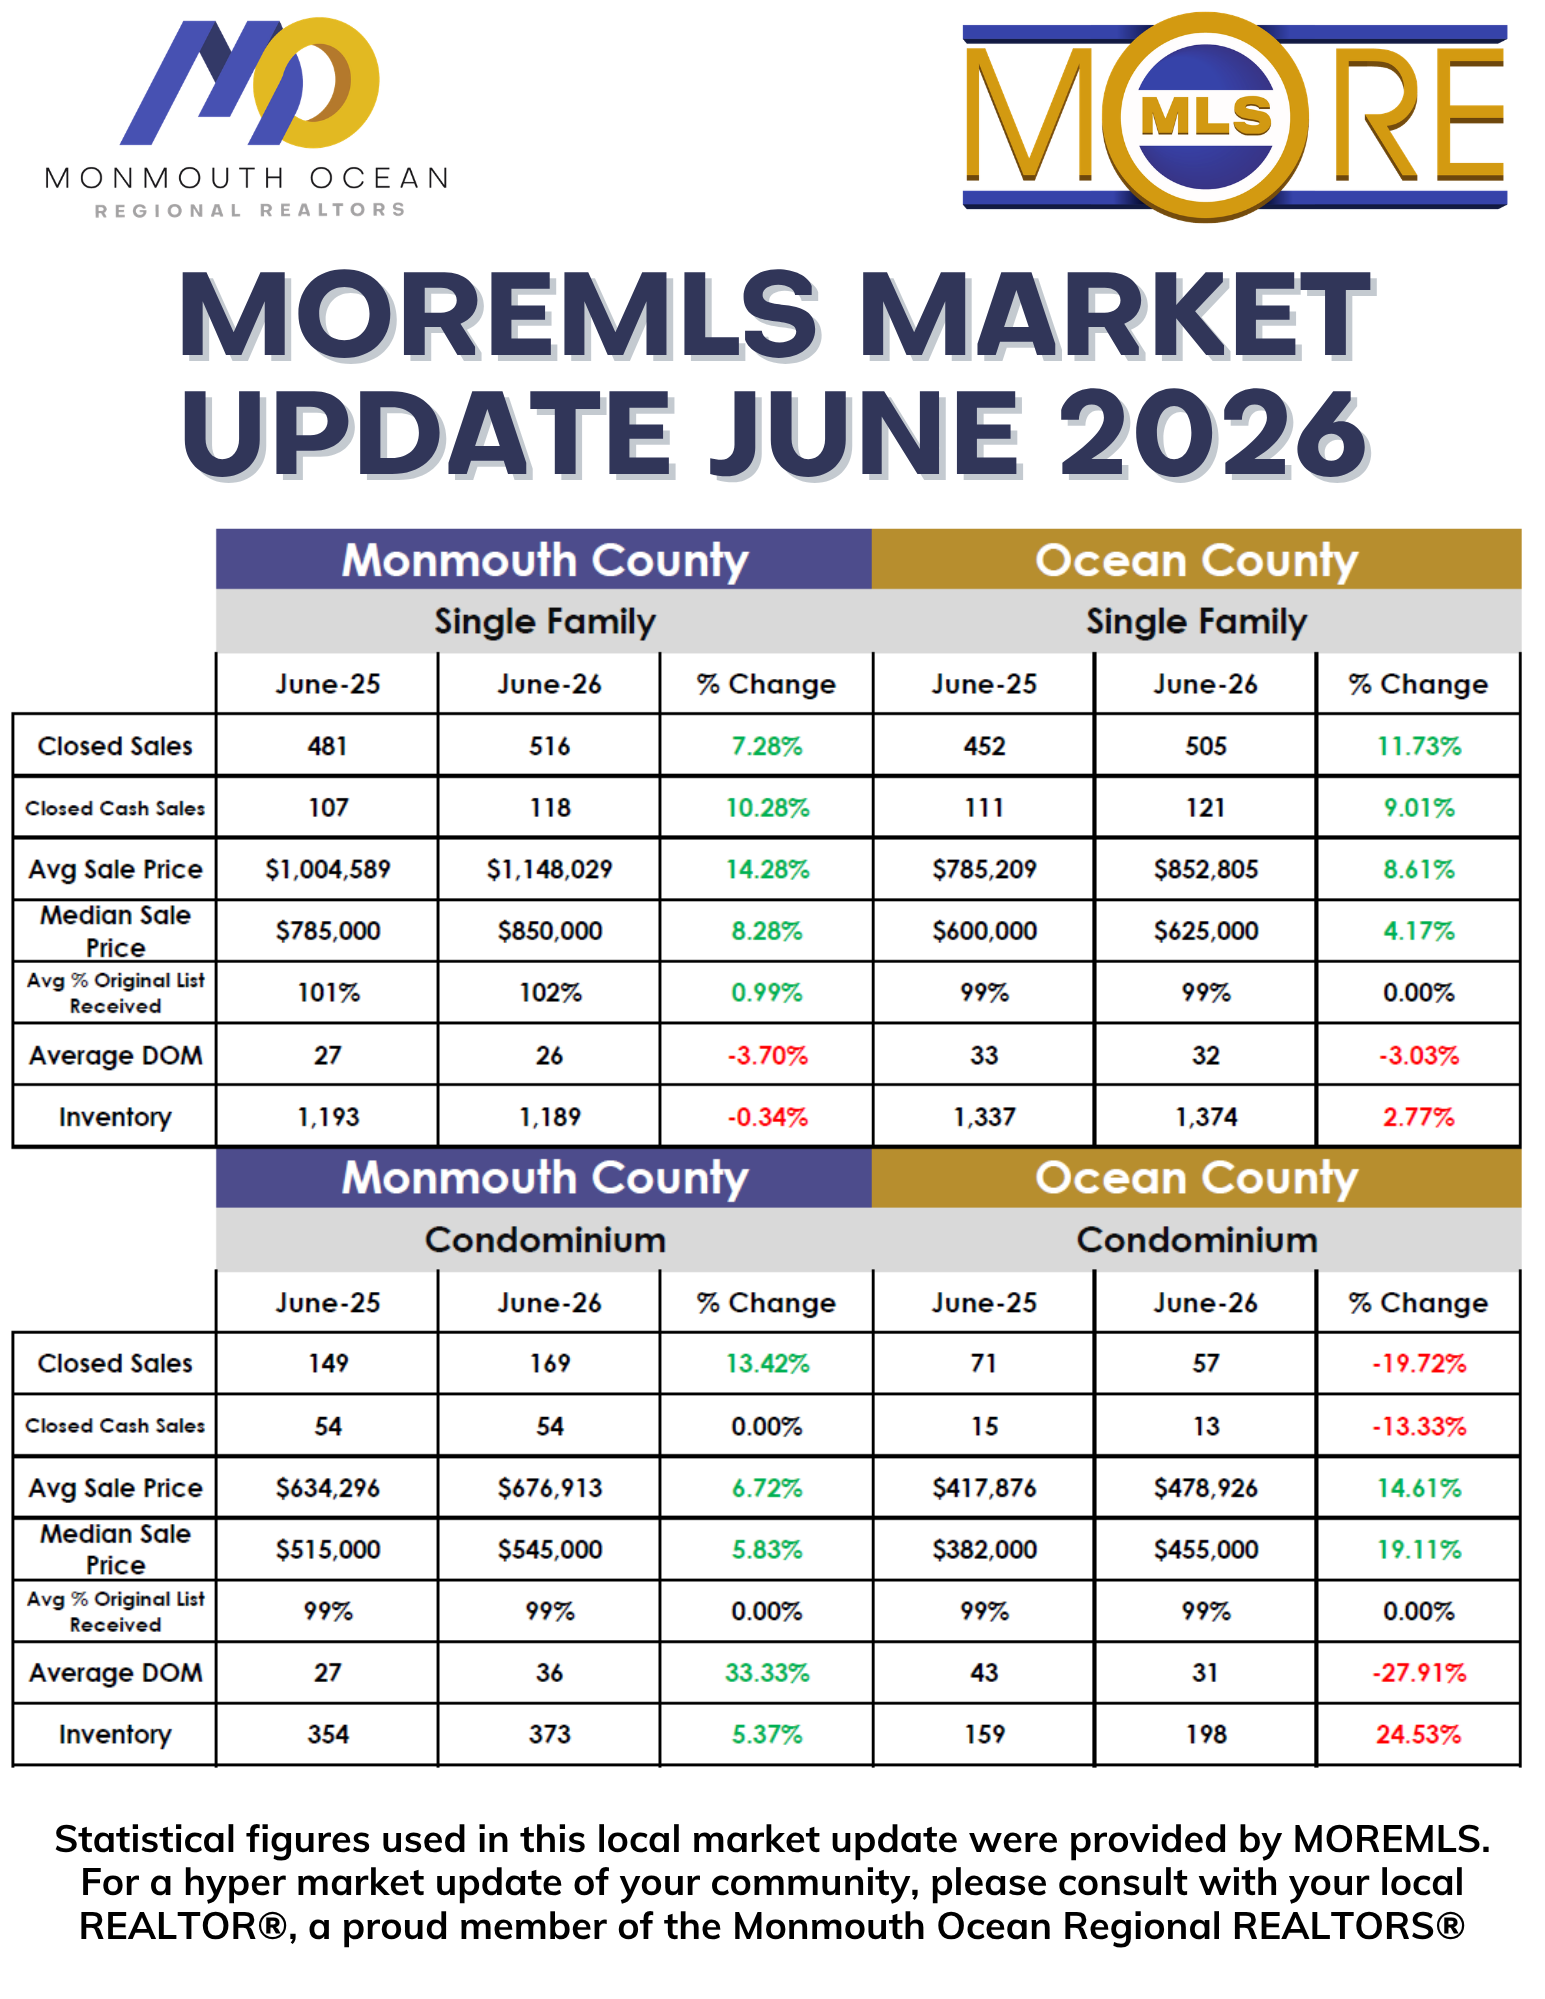
June 2026 Market Stats - Are you a buyer or seller at the Jersey Shore? Are you considering a real estate purchase or sale down the Shore in either the Monmouth or Ocean County markets? If so, consider June 2026’s market data points to continued strength across Ocean and Monmouth Counties, with meaningful differences by property type and location. For single-family homes, both counties saw more closed sales and higher prices than June 2025. Monmouth County closed 516 sales, up 7.3%, with the median sale price rising 8.3% to $850,000. Ocean County closed 505 sales, up 11.7%, while its median price increased 4.2% to $625,000. Homes are still moving quickly—averaging 26 days on market in Monmouth and 32 days in Ocean—and sellers received an average of 102% of original list price in Monmouth and 99% in Ocean. Inventory was essentially flat in Monmouth and increased modestly in Ocean. The condominium market was more varied. Monmouth County condo sales rose 13.4%, with the median price up 5.8% to $545,000. However, average marketing time increased to 36 days, suggesting buyers may have a little more time to evaluate options. In Ocean County, condo sales declined 19.7%, yet prices climbed sharply: the median sale price rose 19.1% to $455,000. Inventory increased 24.5%, while average days on market dropped to 31, indicating that well-positioned condos continue to attract buyers. For sellers, the message is encouraging: values remain elevated, demand is active, and properly priced homes are still attracting strong offers. For buyers, increased inventory—particularly in Ocean County condos—may create more choices, but competitive conditions remain for desirable, well-priced properties. Because conditions can vary significantly by town, price range, and property type, a community-specific market analysis is the best way to plan a successful purchase or sale. During the past year, I’ve donated thousands of dollars to a variety of deserving pet rescue charities as part of my commitment to giving back a portion of my commissions to pets in need. Throughout the upcoming year, my commitment continues, so if you are a pet-lover, let’s talk. You're browsing the official website of Realtor Darren Tietsworth, but did you know I also have some other websites to help you with your search. HolidayCityHomes.com – browse and sell your home in this premier 55+ community JerseyShoreCondo.com – buying, selling or renting condos on the Jersey Shore. OpenHouseNewJersey.com – for Open Houses in Ocean or Monmouth Counties? JerseyShoreCribs.com – for renters & landlords along the Shore JerseyShoreHomez.com – for buyers & sellers in the top Shore towns Exit135.com – Search for homes in Union, Morris, Somerset Counties Contact us today to discuss how we can help to buy or sell a home. You can call or text us at 908.578.3630 or use our contact form here. We look forward to working with you.
By darren.njre • October 16, 2026
September 2026 Real Estate Market Report: What Buyers and Sellers Need to Know in Monmouth and Ocean Counties The latest September 2026 market data from MOREMLS offers valuable insight into the changing real estate landscape across Monmouth and Ocean counties. Comparing September 2026 with September 2025, the numbers reveal a market characterized by fewer closed transactions, mixed pricing trends, and changing inventory levels. For homeowners considering selling, buyers preparing to enter the market, and investors evaluating opportunities along the Jersey Shore, these statistics provide a helpful snapshot of current conditions. Let's take a closer look at what the numbers mean for single-family homes and condominiums in both counties. Monmouth County: Single-Family Home Prices Continue to Rise Monmouth County's single-family housing market demonstrated notable price strength in September 2026, even as closed sales declined slightly compared with the same month last year. Key statistics for September 2026: Closed sales: 460, down 1.08% from 465 in September 2025. Average sale price: $1,171,315, up 13.70% from $1,030,194. Median sale price: $825,000, up 3.77% from $795,000. Average days on market: 30, down from 33 days. Inventory: 1,308 homes, virtually unchanged from 1,309 a year earlier. Average percentage of original list price received: 98%, compared with 100% last year. The most striking figure is the 13.70% increase in the average sale price. The median sale price also increased, suggesting that price growth was not limited to the average alone. However, the larger increase in the average may reflect changes in the mix of homes sold, including a greater share of higher-priced properties. Homes also spent fewer days on the market, averaging 30 days compared with 33 days in September 2025. This suggests that well-positioned properties can still attract buyers relatively quickly. At the same time, sellers received an average of 98% of their original asking price, compared with 100% last year. This indicates that pricing strategy and negotiation remain important, even in a market where home values have increased. What this means: Monmouth County continues to show strong pricing, but sellers should not assume that every property will command its original asking price. Buyers may face higher purchase prices, making preparation, financing, and a clear understanding of local property values essential. Ocean County: A More Mixed Market for Single-Family Homes Ocean County's single-family market showed a different pattern, with a modest decline in the average sale price and a slight increase in available inventory. Key statistics for September 2026: Closed sales: 463, down 4.54% from 485. Average sale price: $748,814, down 3.19% from $773,514. Median sale price: $605,000, up 1.00% from $599,000. Average days on market: 33, down from 35 days. Inventory: 1,522 homes, up 2.15% from 1,490. Average percentage of original list price received: 99%, unchanged from the prior year. The difference between the average and median sale prices deserves attention. Although the average price declined, the median price increased slightly. This can happen when the mix of properties sold changes from one year to the next; it does not necessarily mean that the value of a typical home has fallen. Closed sales declined, while inventory increased modestly. Buyers may therefore find more options than they did a year ago, although availability and competition will vary by neighborhood, price range, and property condition. Homes averaged 33 days on the market, two fewer than the previous September. Sellers also received an average of 99% of their original asking price, indicating that list-price realization remained relatively steady. What this means: Ocean County buyers may have opportunities to compare more properties and negotiate thoughtfully. Sellers can still compete effectively, but accurate pricing and strong presentation are important in a market where overall sales volume has softened. Monmouth County Condominiums: Prices and Inventory Move Higher The condominium market in Monmouth County showed positive price trends alongside a meaningful increase in available inventory. Key statistics for September 2026: Closed sales: 134, down 13.55% from 155. Average sale price: $626,222, up 1.76% from $615,392. Median sale price: $556,500, up 6.00% from $525,000. Average days on market: 30, down from 31 days. Inventory: 417 units, up 18.80% from 351. Average percentage of original list price received: 100%, up from 98%. The rise in the median sale price is encouraging for condominium owners, while the increase in inventory gives buyers more properties to consider. However, closed condominium sales fell by nearly 14% year over year. That decline suggests that higher prices have not translated into a greater number of completed transactions. One positive sign for sellers is that the average percentage of original asking price received reached 100%. While this is an aggregate figure rather than a guarantee for any individual listing, it indicates that appropriately priced condominiums continued to perform well. What this means: Buyers may benefit from a broader selection of condominiums, while sellers can still achieve favorable results when their properties are priced and marketed effectively. Buyers should also compare association fees, maintenance costs, amenities, and any applicable condominium association requirements when evaluating a purchase. Ocean County Condominiums: The Biggest Inventory Increase Ocean County's condominium market recorded the sharpest inventory growth among the four market segments in the report. Prices also increased, even as closed sales declined significantly. Key statistics for September 2026: Closed sales: 43, down 27.12% from 59. Average sale price: $468,276, up 8.81% from $430,378. Median sale price: $398,000, up 16.37% from $342,000. Average days on market: 34, down from 37 days. Inventory: 235 units, up 39.05% from 169. Average percentage of original list price received: 99%, up from 98%. The increase in the median sale price is the largest percentage gain among the four average and median price measures shown in the graphic. Nevertheless, the decline in closed sales and the substantial rise in inventory suggest that buyers and sellers are experiencing different sides of the market. Buyers may have more opportunities to compare condominium options, while sellers face a larger pool of competing listings. Even with higher reported sale prices, the decline in transactions means that pricing and property-specific demand deserve careful attention. The increase in prices should also be interpreted in context. With only 43 closed sales in September 2026, changes in the mix of condominiums sold can have a considerable effect on monthly average and median figures. What this means: Ocean County condominium buyers may have greater choice and room to evaluate their options. Sellers should pay close attention to competing listings and avoid relying solely on last year's sale prices when determining an asking price. Four Market Trends Worth Watching Across both counties and both property types, several important patterns emerge from the September figures. 1. Closed sales declined in every category. The number of closed sales fell year over year across all four segments: Monmouth single-family homes: down 1.08%. Ocean single-family homes: down 4.54%. Monmouth condominiums: down 13.55%. Ocean condominiums: down 27.12%. The largest decline occurred in Ocean County condominiums. These figures show fewer completed transactions, but they do not establish the cause. Mortgage rates, affordability, seasonal patterns, available inventory, and other local factors may all influence sales activity. 2. Prices were stronger in Monmouth County and in both condominium markets. Monmouth County single-family homes recorded a 13.70% increase in average sale price. Ocean County single-family homes, by contrast, saw a 3.19% decrease in the average, although the median rose 1.00%. Condominium prices increased in both counties, with Ocean County showing the larger percentage gains in average and median sale prices. These differences reinforce the importance of evaluating the specific county and property type rather than relying on one broad market headline. 3. Inventory is increasing most noticeably for condominiums. Single-family inventory remained nearly flat in Monmouth County and increased 2.15% in Ocean County. Condominium inventory rose 18.80% in Monmouth County and 39.05% in Ocean County. For buyers, additional listings can mean more opportunities to compare properties. For sellers, it can mean greater competition. However, inventory alone does not tell us how many months of supply are available, because that calculation also depends on the pace of sales. 4. Homes are spending slightly less time on the market. Average days on market declined in all four categories: Monmouth single-family homes: 30 days. Ocean single-family homes: 33 days. Monmouth condominiums: 30 days. Ocean condominiums: 34 days. This is an important counterpoint to the decline in closed sales. Properties that sell are, on average, spending fewer days on the market than they did a year ago. That does not necessarily mean every listing is selling faster, since the statistic reflects properties that reached a sale and can be affected by the mix of transactions. Advice for Homebuyers in Fall 2026 For buyers, the September market data suggest that preparation and flexibility remain essential. Understand the local market. A buyer considering a single-family home in Monmouth County may face a different pricing environment than someone searching for a condominium in Ocean County. Compare recent comparable sales. Countywide averages provide useful context, but recent sales of similar properties in the same neighborhood are generally more relevant when determining fair value. Explore your options. Rising condominium inventory, particularly in Ocean County, may give buyers more properties to evaluate. Take time to compare condition, location, carrying costs, and potential resale considerations. Get financing in order. A mortgage preapproval and a clear budget can help buyers move decisively when an appropriate property becomes available. Negotiate strategically. Average sale prices and list-price percentages do not guarantee that a particular home will sell at a given price. Property condition, seller circumstances, and competing offers all matter. Advice for Home Sellers in Fall 2026 Sellers can still find opportunities in this market, but a successful sale begins with a realistic understanding of the competition. Price your home based on current comparable sales. Strong year-over-year price gains in some segments do not mean every property has appreciated at the same rate. Make a strong first impression. Professional photography, thoughtful staging, and attention to maintenance can help a listing stand out. Monitor competing inventory. This is especially important for condominium sellers, given the substantial year-over-year inventory increases in both counties. Be prepared to negotiate. Monmouth single-family sellers received an average of 98% of original list price, while the other three categories ranged from 99% to 100%. These figures are useful benchmarks, not guaranteed outcomes. Work with a local real estate professional. An experienced agent can help interpret neighborhood-level activity, evaluate competing listings, and develop a marketing strategy suited to your property and timeline. The Bottom Line: Local Knowledge Matters September 2026's MOREMLS statistics show that Monmouth and Ocean counties continue to offer distinct real estate opportunities. Monmouth County's single-family market stands out for its strong increase in average sale price, while Ocean County's single-family market shows a slight decline in average price alongside a modest increase in inventory. Condominium prices increased in both counties, but sales declined and inventory rose, particularly in Ocean County. For buyers, the changing inventory picture may create opportunities to compare properties and negotiate. For sellers, the data reinforce the importance of competitive pricing, effective marketing, and an understanding of current local demand. Ultimately, countywide statistics are only part of the story. Neighborhood, price range, property condition, and individual circumstances all influence the outcome of a real estate transaction. Whether you're thinking about buying, selling, or simply monitoring your home's value, the best starting point is a conversation with a knowledgeable local REALTOR® who can put these numbers into context for your specific market. Source: September 2026 MOREMLS market statistics, comparing September 2025 with September 2026. Figures reflect reported single-family and condominium activity in Monmouth and Ocean counties. Average and median sale prices may be influenced by the mix of properties sold during each period. Market statistics are descriptive and do not guarantee future results.
By darren.njre • September 4, 2026
July 2026 Market Stats - A tale of multiple markets The July numbers show a generally strong Jersey Shore housing market, particularly for single-family homes. Prices are higher than a year ago in both counties, while homes continue to sell very close to—or above—their original asking prices. For Buyers: Competition remains significant. Monmouth County single-family homes sold for an average of 102% of original list price, while Ocean County averaged 101%. Median prices rose to $816,000 in Monmouth (+5.3%) and $634,999 in Ocean (+5.8%). The encouraging news is inventory: Ocean County single-family inventory increased slightly, while condo inventory grew 5.4% in Monmouth and 16.9% in Ocean, potentially giving condo buyers more choices and negotiating opportunities. For Sellers: Single-family conditions remain favorable. Average sale prices jumped 13.2% in Monmouth County to $1.029 million and 10.9% in Ocean County to $785,860. Homes averaged just 29 days on market in Monmouth and 35 days in Ocean, unchanged from last year. Cash purchases also increased substantially in both counties. The condo market is more mixed. Monmouth condo sales declined 10.3% and average prices fell 2.7%, although average market time improved dramatically from 39 to 27 days. Ocean County condos saw sales increase 10.9% and average prices rise 12.3%, but inventory climbed nearly 17% and average market time increased to 36 days. Bottom line: Single-family sellers continue to have considerable leverage, while buyers should be prepared for well-priced homes to attract strong offers. The expanding condo inventory—particularly in Ocean County—could create better opportunities for buyers heading into the late-summer and fall market. During the past year, I’ve donated thousands of dollars to a variety of deserving pet rescue charities as part of my commitment to giving back a portion of my commissions to pets in need. Throughout the upcoming year, my commitment continues, so if you are a pet-lover, let’s talk. You're browsing the official website of Realtor Darren Tietsworth, but did you know I also have some other websites to help you with your search. HolidayCityHomes.com – browse and sell your home in this premier 55+ community JerseyShoreCondo.com – buying, selling or renting condos on the Jersey Shore. OpenHouseNewJersey.com – for Open Houses in Ocean or Monmouth Counties? JerseyShoreCribs.com – for renters & landlords along the Shore JerseyShoreHomez.com – for buyers & sellers in the top Shore towns Exit135.com – Search for homes in Union, Morris, Somerset Counties Contact us today to discuss how we can help to buy or sell a home. You can call or text us at 908.578.3630 or use our contact form here. We look forward to working with you.
By darren.njre • July 18, 2026
June 2026 Market Stats - Are you a buyer or seller at the Jersey Shore? Are you considering a real estate purchase or sale down the Shore in either the Monmouth or Ocean County markets? If so, consider June 2026’s market data points to continued strength across Ocean and Monmouth Counties, with meaningful differences by property type and location. For single-family homes, both counties saw more closed sales and higher prices than June 2025. Monmouth County closed 516 sales, up 7.3%, with the median sale price rising 8.3% to $850,000. Ocean County closed 505 sales, up 11.7%, while its median price increased 4.2% to $625,000. Homes are still moving quickly—averaging 26 days on market in Monmouth and 32 days in Ocean—and sellers received an average of 102% of original list price in Monmouth and 99% in Ocean. Inventory was essentially flat in Monmouth and increased modestly in Ocean. The condominium market was more varied. Monmouth County condo sales rose 13.4%, with the median price up 5.8% to $545,000. However, average marketing time increased to 36 days, suggesting buyers may have a little more time to evaluate options. In Ocean County, condo sales declined 19.7%, yet prices climbed sharply: the median sale price rose 19.1% to $455,000. Inventory increased 24.5%, while average days on market dropped to 31, indicating that well-positioned condos continue to attract buyers. For sellers, the message is encouraging: values remain elevated, demand is active, and properly priced homes are still attracting strong offers. For buyers, increased inventory—particularly in Ocean County condos—may create more choices, but competitive conditions remain for desirable, well-priced properties. Because conditions can vary significantly by town, price range, and property type, a community-specific market analysis is the best way to plan a successful purchase or sale. During the past year, I’ve donated thousands of dollars to a variety of deserving pet rescue charities as part of my commitment to giving back a portion of my commissions to pets in need. Throughout the upcoming year, my commitment continues, so if you are a pet-lover, let’s talk. You're browsing the official website of Realtor Darren Tietsworth, but did you know I also have some other websites to help you with your search. HolidayCityHomes.com – browse and sell your home in this premier 55+ community JerseyShoreCondo.com – buying, selling or renting condos on the Jersey Shore. OpenHouseNewJersey.com – for Open Houses in Ocean or Monmouth Counties? JerseyShoreCribs.com – for renters & landlords along the Shore JerseyShoreHomez.com – for buyers & sellers in the top Shore towns Exit135.com – Search for homes in Union, Morris, Somerset Counties Contact us today to discuss how we can help to buy or sell a home. You can call or text us at 908.578.3630 or use our contact form here. We look forward to working with you.

MY FACEBOOK FEED

CONTACT

  • Next Steps, let's connect!

  • How much is your home worth? Let's explore current market trends, comparable recently sold and other on the market.

  • Here to assist you will all your home finding or selling needs.


Get in Touch